How many Arena players use 17Lands?
It is undeniable that 17Lands had a major influence on the Magic Draft community and shaped how we talk about the game. By providing valuable statistics for discussion and format exploration, it’s hard to imagine Limited Magic without it.
Computing these stats is only possible due to the contribution of data by all players who installed the 17Lands client on their computer. These users’ play behavior and performance generate the data we analyze. While the number of tracked games is large enough for win rates and ALSA values to be statistically meaningful, they do not cover 100% of all games played.
The most obvious sign of that is that the average win rate is around 55% for most sets. If all games were tracked, the average win rate would be 50% — since both the winning and losing sides of each game would be recorded. Because of that we know that 17Lands users have a higher win rate than non-17Lands users.
An interesting question is: what percentage of total drafts are tracked by 17Lands? However, answering this question is not straightforward with the available data.
This article will explain the idea and methodology used to estimate the percentage of tracked drafts. It will present the results for both Premier and Traditional Draft and how it changes over time.
Methodology
This problem is difficult to solve because we don’t know how many drafts occur without any 17Lands users. Only Arena has the concrete answer to that, and it is unlikely that they will share it with us.
To estimate the percentage of 17Lands drafts we use the following trick: Each draft in our dataset is treated as a random sample of the general Arena draft population, with a sample size of seven — the number of other players at the table. Then we count how many of the seven other players are also using 17Lands by using a matching algorithm. This provides the percentage of draft seats tracked by 17Lands, allowing us to estimate the total number of drafts.
Some caveats about this approach. Despite the article’s title, we can estimate the number of drafts tracked by 17Lands, but not the number of individual players using it. The dataset doesn’t disclose a unique player identifier that would be necessary for this analysis. Frequent drafters generate more draft logs. If 17Lands users draft more frequently than non-users, the percentage of actual players will be lower than our estimate.
Another consideration is that the share of drafts is not equal to the share of games in Premier Draft. Since skilled players tend to play more games before dropping out, this inflates the numbers. You are likely to face 17Lands users more often than their draft share suggests, as they generally play more games. In Traditional Draft, where everyone plays the same number of matches, this will not be the case.
Finally, our sample timing is not random—it only includes instances when 17Lands users draft. Therefore, we introduce a certain time bias that could under-represent certain timezones.
For example, assuming the majority of 17Lands users are in the US, then most samples available to us are taken at times when people in the US timezone are likely to play Magic. If there is a big group of players in another timezone with fewer 17Lands users then these drafts will show up less often in the dataset.
Data
For this analysis we use the public dataset containing draft data of the first three weeks of Aetherdrift. For Premier Draft the dataset consists of 4,580,136 data points. For Traditional Draft the number is 568,955. Each row represents a pick in a draft and has information about which cards are in the pack and current pool. In total 123,635 drafts are covered by both datasets.
Matching Algorithm
The most computationally intensive part of this project is running the algorithm to identify drafts occurring at the same table. To do this we do the following steps for each unique draft seat in the dataset:
- Look at pack 1 pick 8 and take note of all cards in the pack.
- Compare pack 1 pick 1-7 for each other draft that has a close enough timestamp
- If all cards from step 1 are present in a pack of step 2 we have a potential candidate
- To confirm a match, we compare all other picks.
The timeframe in which we look for matches should be large enough to make sure we don’t miss any matches but not too large because it increases the computation time due to more comparisons. Testing with larger timeframes showed that no matches had a time difference greater than two minutes.
Knowing the number of matches and total drafts allows us to calculate the share of drafts tracked by 17Lands. We simply divide the number of matches by the amount of drafts * 7, which is equal to the share of observed draft seats taken by 17Lands users.
To make sure that assumption is correct, it was tested on simulated data.
Level Up Your Drafts! 🔥
Subscribe to our newsletter to get notified about
- 📰 New posts with the latest meta updates
- 🧠 Deep dives into top archetypes
- 📊 Exclusive tools to analyze data
Results
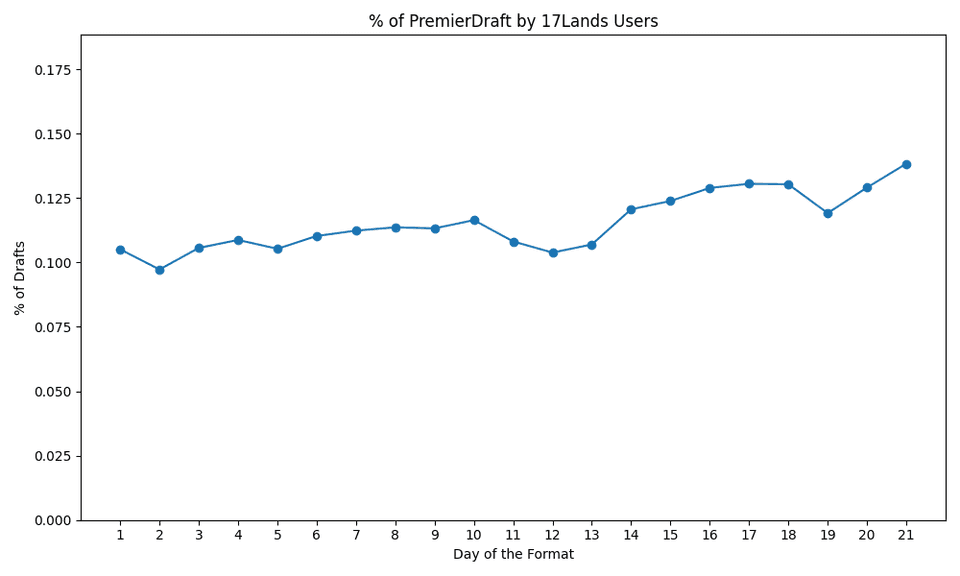
Without further ado, here are the results. In the Premier Draft dataset the algorithm found 86,990 matches. With the total number of drafts being 109,992 this means that 11.3% of all drafts were recorded by 17Lands.
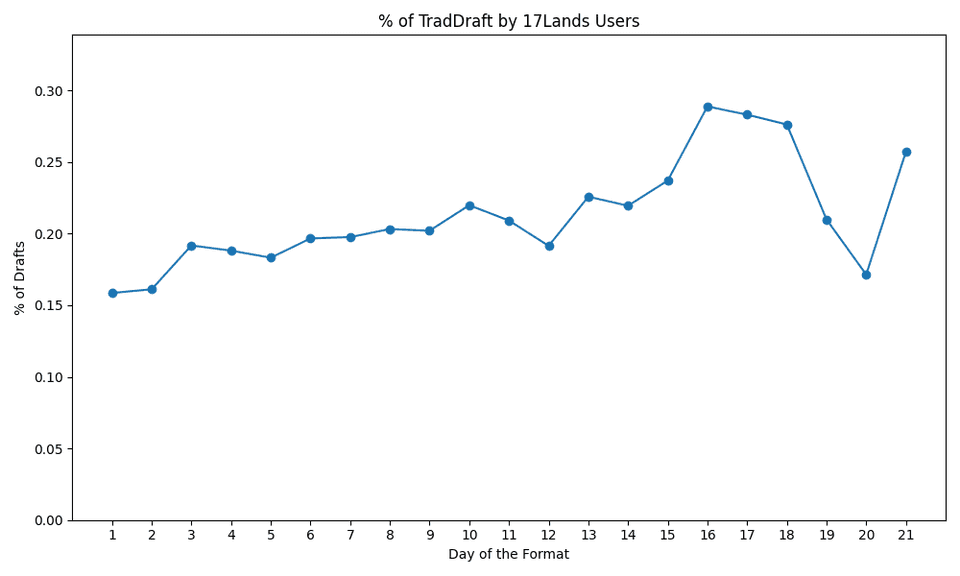
Regarding Traditional Draft the 20,332 matches and 13,643 drafts result in 21.29% draft share.
Changes over time
Digging a little deeper into the data, we can look at how this number changes over time. Looking at the graph below we see a steady rise during the three weeks of available data.
Since we know that the number of drafts is decreasing with each week, this means that the 17Lands players stick with the format longer than the average Arena player. It is safe to assume that the number will increase even further as the grinders are the only ones left playing. An update of the graph will be posted here as well as soon as the next dataset is released. Make sure not to miss it by subscribing to our newsletter.
The plot for Traditional Draft also shows an increase over time. Since the amount of data is much lower than for Premier Draft the line is not as smooth.
If you follow the discussion about 17Lands data for a while you might have heard about the phenomenon that the overall win rate of 17Lands users declines as the format evolves. This is often attributed to the general player population figuring out what’s good and 17Lands users losing their edge in that regard. While this is for sure correct, we see another factor contributing here. With a higher percentage of 17Lands users in the draft pods the overall win rate has to approach 50%.
Conclusion
I hope you found this article insightful. While this analysis may not directly improve your drafting, it offers a deeper understanding of the environment we play in.
Here are all findings in an easy to parse way:
- For the first three weeks of Aetherdrift 11.3% of Premier and 21.29% of Traditional Drafts were tracked by 17Lands.
- The number is increasing as the format goes on, indicating that 17Lands user stick longer with it then the general Arena player.
With the release of the next 17Lands dataset, I will post an update to check in how the numbers are climbing up as the format continues. If you’re interested in that and want to support the site, make sure to subscribe to our free weekly newsletter.